When your C/C++ project is built and ready for debugging, you can follow the steps below to invoke the Intel® Debugger (See Compiler or Eclipse/CDT* documentation for details on creating and building projects):
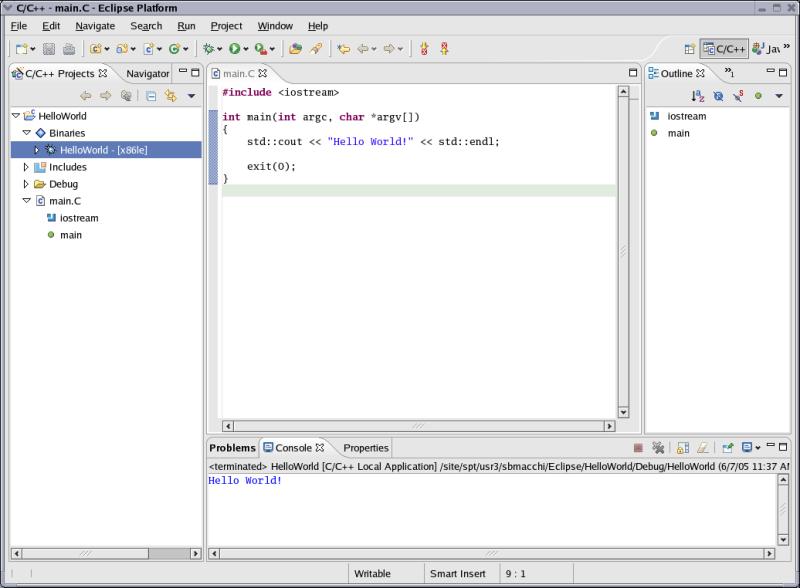
1.Select the executable to debug.
Choose >Run > Debug...from the main menu.
2. Click the Debugger tab.
Choose the Intel® Debugger from the Debugger drop-down list.
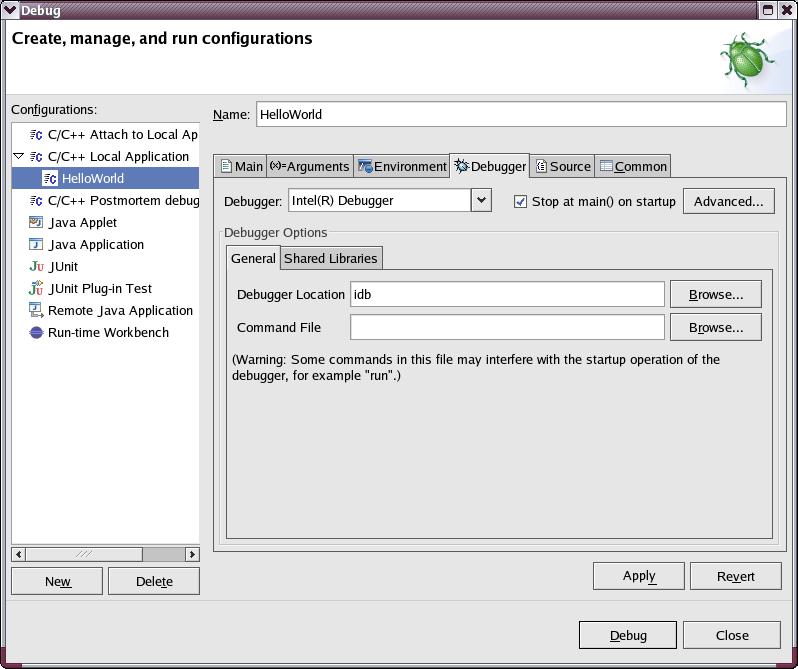
3. If you have started Eclipse with iccec or idbec, or you ran idbvars.sh or idbvars.csh, skip step 4.
4. If you have not started Eclipse with iccec or idbec, or you did not run idbvars.sh or idbvars.csh, put the full path to the debugger executable in the "Debugger Location" field:
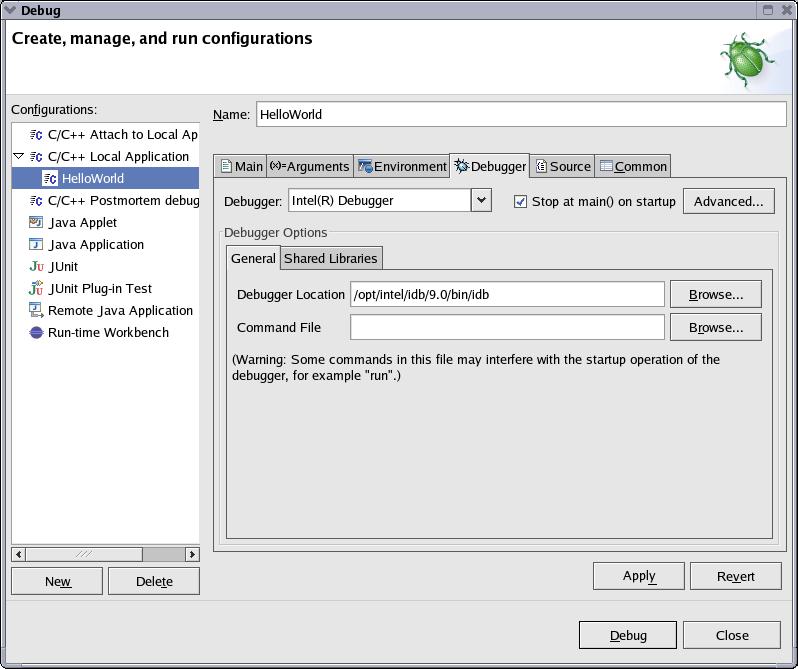
5. Click the Debug button.
For subsequent debug sessions, you just have to select the program in the navigator tab and then select Run > Debug As > C/C++ Local Application (or to click the bug icon in the toolbar).
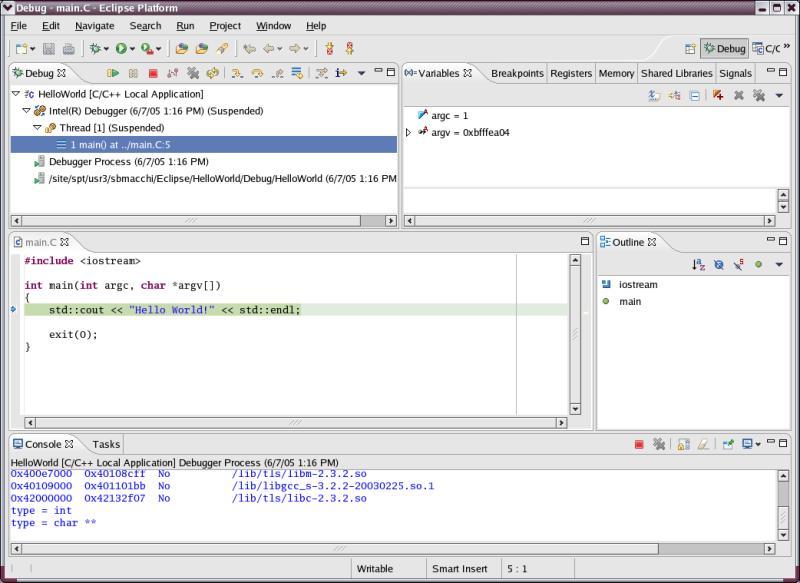
The perspective will switch to the debug perspective like the example below: