
These subroutines compute the convolutions and correlations of a sequence with one or more sequences using a direct method. The input and output sequences contain short-precision real numbers.
| Fortran | CALL SCON | SCOR (init, h, inc1h, x, inc1x, inc2x, y, inc1y, inc2y, nh, nx, m, iy0, ny, aux1, naux1, aux2, naux2) |
| C and C++ | scon | scor (init, h, inc1h, x, inc1x, inc2x, y, inc1y, inc2y, nh, nx, m, iy0, ny, aux1, naux1, aux2, naux2); |
| PL/I | CALL SCON | SCOR (init, h, inc1h, x, inc1x, inc2x, y, inc1y, inc2y, nh, nx, m, iy0, ny, aux1, naux1, aux2, naux2); |
If init <> 0, no computation is performed, error checking is performed, and the subroutine exits back to the calling program.
If init = 0, the convolutions or correlations of the sequence in h with the sequences in x are computed.
Specified as: a fullword integer. It can have any value.
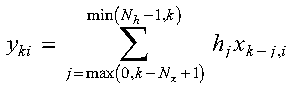
The convolutions and correlations of a sequence in array H with one or more sequences in array X are expressed as follows:
Convolutions for SCON:
Correlations for SCOR:
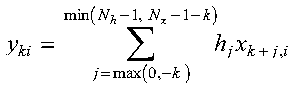
for:
where:
It is assumed that elements outside the range of definition are zero. See references [17] and [84].
Only one invocation of this subroutine is needed:
None
This example shows how to compute a convolution of a sequence in H, which is a ramp function, and three sequences in X, a triangular function and its cyclic translates. It computes the full range of nonzero values of the convolution plus two extra points, which are set to 0. The arrays are declared as follows:
     REAL*4   H(0:4999), X(0:49999), Y(0:49999)
     REAL*8   AUX1, AUX2
          INIT  H INC1H X INC1X INC2X Y INC1Y INC2Y NH NX  M IY0 NY  AUX1 NAUX1 AUX2 NAUX2
           |    |   |   |   |     |   |   |     |    |  |  |  |   |   |     |    |     |
CALL SCON(INIT, H , 1 , X , 1 ,  10 , Y , 1 ,  15 , 4, 10, 3, 0, 15, AUX1 , 0 , AUX2 , 0)
X contains the following three sequences:
1.0  2.0  3.0
2.0  1.0  2.0
3.0  2.0  1.0
4.0  3.0  2.0
5.0  4.0  3.0
6.0  5.0  4.0
5.0  6.0  5.0
4.0  5.0  6.0
3.0  4.0  5.0
2.0  3.0  4.0
Y contains the following three sequences:
 1.0   2.0   3.0
 4.0   5.0   8.0
10.0  10.0  14.0
20.0  18.0  22.0
30.0  20.0  18.0
40.0  30.0  20.0
48.0  40.0  30.0
52.0  48.0  40.0
50.0  52.0  48.0
40.0  50.0  52.0
29.0  38.0  47.0
18.0  25.0  32.0
 8.0  12.0  16.0
 0.0   0.0   0.0
 0.0   0.0   0.0
This example shows how the output from Example 1 differs when the values for NY and inc2y are 10 rather than 15. The output is the same except that it consists of only the first 10 values produced in Example 1.
Y contains the following three sequences:
 1.0   2.0   3.0
 4.0   5.0   8.0
10.0  10.0  14.0
20.0  18.0  22.0
30.0  20.0  18.0
40.0  30.0  20.0
48.0  40.0  30.0
52.0  48.0  40.0
50.0  52.0  48.0
40.0  50.0  52.0
This example shows how the output from Example 2 differs if the value for IY0 is 3 rather than 0. The output is the same except it starts at element 3 of the convolution sequences rather than element 0.
Y contains the following three sequences:
20.0  18.0  22.0
30.0  20.0  18.0
40.0  30.0  20.0
48.0  40.0  30.0
52.0  48.0  40.0
50.0  52.0  48.0
40.0  50.0  52.0
29.0  38.0  47.0
18.0  25.0  32.0
 8.0  12.0  16.0
This example shows how to compute a correlation of a sequence in H, which is a ramp function, and three sequences in X, a triangular function and its cyclic translates. It computes the full range of nonzero values of the correlation plus two extra points, which are set to 0. The arrays are declared as follows:
     REAL*4   H(0:4999), X(0:49999), Y(0:49999)
     REAL*8   AUX1, AUX2
          INIT  H INC1H X INC1X INC2X Y INC1Y INC2Y NH NX  M IY0  NY  AUX1  NAUX1 AUX2 NAUX2
           |    |   |   |   |     |   |   |     |   |  |   |   |   |   |      |    |     |
CALL SCOR(INIT, H , 1 , X , 1  , 10 , Y , 1  , 15 , 4, 10, 3, -3, 15, AUX1 ,  0 , AUX2 , 0)
X contains the following three sequences:
1.0  2.0  3.0
2.0  1.0  2.0
3.0  2.0  1.0
4.0  3.0  2.0
5.0  4.0  3.0
6.0  5.0  4.0
5.0  6.0  5.0
4.0  5.0  6.0
3.0  4.0  5.0
2.0  3.0  4.0
Y contains the following three sequences:
 4.0   8.0  12.0
11.0  10.0  17.0
20.0  15.0  16.0
30.0  22.0  18.0
40.0  30.0  22.0
50.0  40.0  30.0
52.0  50.0  40.0
48.0  52.0  50.0
40.0  48.0  52.0
30.0  40.0  48.0
16.0  22.0  28.0
 7.0  10.0  13.0
 2.0   3.0   4.0
 0.0   0.0   0.0
 0.0   0.0   0.0
This example shows how the output from Example 4 differs when the values for NY and INC2Y are 10 rather than 15. The output is the same except that it consists of only the first 10 values produced in Example 4.
Y contains the following three sequences:
 4.0   8.0  12.0
11.0  10.0  17.0
20.0  15.0  16.0
30.0  22.0  18.0
40.0  30.0  22.0
50.0  40.0  30.0
52.0  50.0  40.0
48.0  52.0  50.0
40.0  48.0  52.0
30.0  40.0  48.0
This example shows how the output from Example 5 differs if the value for IY0 is 0 rather than -3. The output is the same except it starts at element 0 of the correlation sequences rather than element -3.
Y contains the following three sequences:
30.0  22.0  18.0
40.0  30.0  22.0
50.0  40.0  30.0
52.0  50.0  40.0
48.0  52.0  50.0
40.0  48.0  52.0
30.0  40.0  48.0
16.0  22.0  28.0
 7.0  10.0  13.0
 2.0   3.0   4.0