|
|
 |
|
|
|
|
Visualization
TotalView gives you a variety of ways to visualize your data.
- The TotalView Visualizer allows you to graphically view array data in the programs you are debugging. This gives you an overall picture of your data and helps you find incorrect data quickly and easily.
Note: The Visualizer is not available on Linux Alpha and 32-bit SGI Irix.
Each time you visualize the same array, the Visualizer image is updated. Here is an example:
Sample Array Visualization 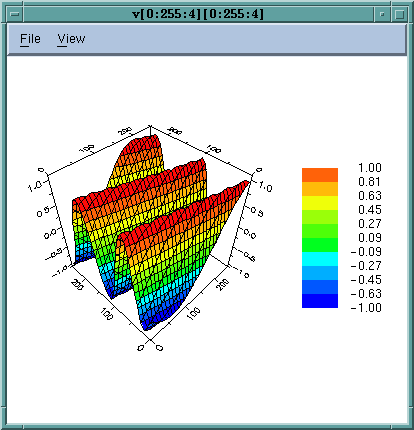
|
- TotalView's Call Tree lets you see the sequence of calls associated with any current routine. This display is dynamic as it displays a program's call tree at the time when you ask for it.
Sample Call Tree 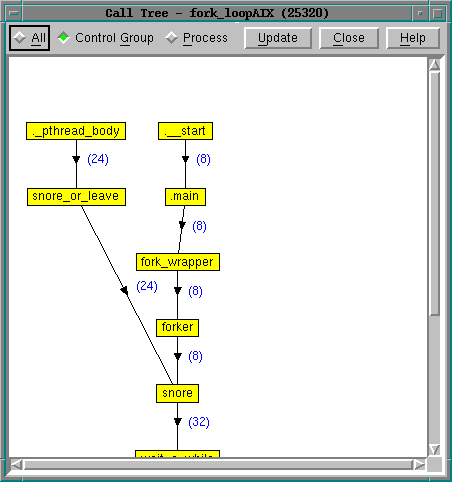
|
- TotalView's Message Queue Graph visually displays the processes (as rank numbers) that are linked together by the messages that each send and receive. You can control what you are seeing by selecting Pending Sends, Pending Receives, and Unexpected Messages. Another control lets you select which messages participate in the graph.
Sample Message Queue Graph 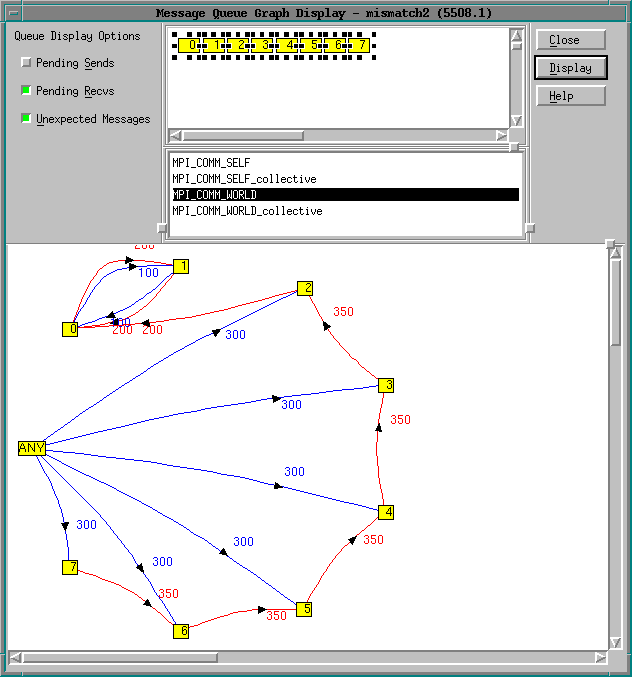
|
|
| |
|
|
|
|