|
|
 |
|
|
|
|
Debugging an OpenMP Program
Debugging OpenMP code is very similar to debugging multithreaded code, differing only in that the OpenMP compiler makes the following special code transformations:
TotalView makes these transformations visible in the debugging session. Here are some things you should know:
- The compiler may generate multiple outlined routines from a single parallel region. This means that a single line of source code can generate multiple blocks of machine code inside different functions.
If you set a breakpoint on a source line that results in multiple outlined routines, TotalView displays its Ambiguous Line dialog box that lets you to select the function name. In most cases, you will select the All button to operate on all instances of the outlined functions.
- You cannot single step into or out of a parallel region. Instead, set a breakpoint inside the parallel region and allow the process to run to it. Once inside a parallel region, you can single step within it.
- OpenMP programs are multithreaded programs, so the rules for debugging multithreaded programs apply.
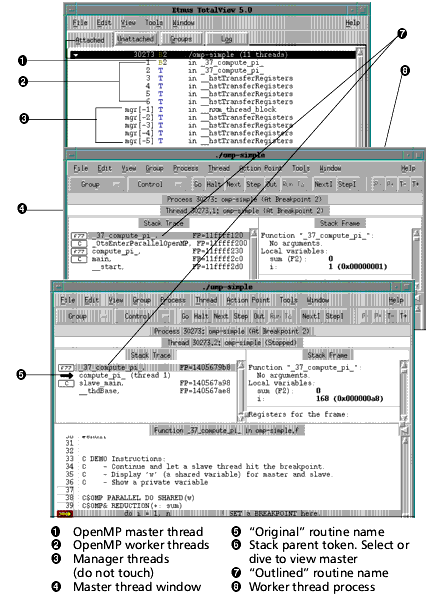
The following figure shows a sample OpenMP debugging session.
Sample OpenMP Debugging Session 
|
The following list contains information on platform differences:
- On Compaq Tru64 UNIX, the OpenMP threads are implemented by the compiler as pthreads, and on SGI IRIX as sprocs. TotalView shows the threads' logical and/or system thread ID, not the OpenMP thread number.
- The OpenMP master thread has logical thread ID number 1. The OpenMP worker threads have a logical thread ID number greater than 1.
- In Compaq Tru64 UNIX, the system manager threads have a negative thread ID; as they do not take part in your OpenMP program, you should never touch them.
- SGI OpenMP uses the SIGTERM signal to terminate threads. Because TotalView stops a process when the process receives a SIGTERM, the OpenMP process does not terminate. If you want the OpenMP process to terminate instead of stop, set the default action for the SIGTERM signal to Resend.
- When the OpenMP master thread is stopped in a PARALLEL DO outlined routine, the stack backtrace shows the following call sequence:
- The outlined routine called from.
- The OpenMP runtime library called from.
- The original routine (containing the parallel region).
- When the OpenMP worker threads are stopped in a PARALLEL DO outlined routine, the stack backtrace shows the following call sequence:
- Outlined routine called from the special stack parent token line.
- The OpenMP runtime library called from.
- Select or dive on the stack parent token line to view the original routine's stack frame in the OpenMP master thread.
|
| |
|
|
|
|


