TotalView Windows
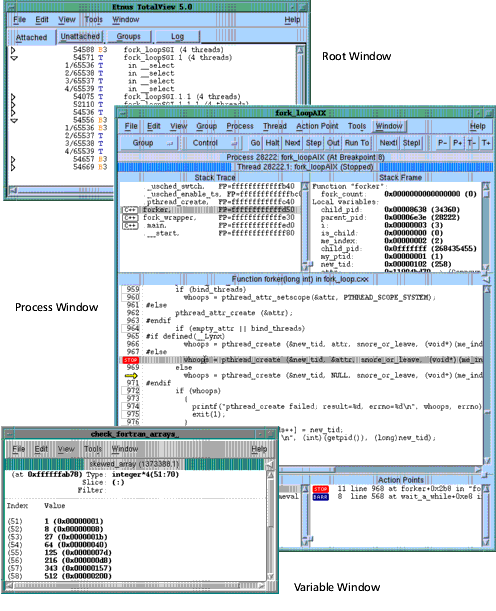
The three most often used windows within TotalView are shown in the following figure.
TotalView Windows 
|
Root Window
Gives you an overview of the state of your program. You can also use it as a navigation tool.
This window has tabbed pages that contain information about the processes and threads being debugged, processes that TotalView could acquire for debugging, groups that you can use to manipulate these processes and threads, and a log that records your entire session.
Process Window
Displays information about a process and a thread within that process. Panes within this window show the stack trace, stack frame, and code for the selected thread. This window is where you will spend the bulk of all your debugging activities.
Variable Window
Lists the address, data type, and value of a local variable, register, or global variable. It also shows the values stored in a block of memory.


