Displaying the Call Tree
Debugging is an art, not a science. Locating a problem is often 90% or more of the effort. Debugging often means having the "intuition" to know what a problem means and where to look for it. TotalView's call tree is one tool that helps you get an understanding of what your program is doing so that you can begin to understand how your program is executing.
Use the Tools > Call Tree command in the Process Window to tell TotalView to display a call tree window.
Tools > Call Tree Dialog Box 
|
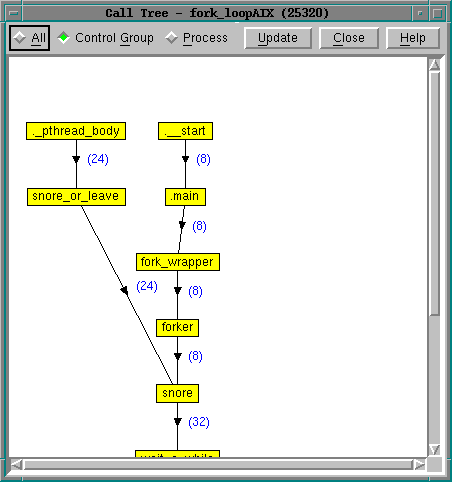
The call tree is a diagram showing all the currently active routines. These routines are linked by arrows indicating that one routine is called by another. This call tree is a dynamic call tree in that it displays the call tree at the time when TotalView creates the call tree. The Update button tells TotalView to recreate this display.
You can tell TotalView to display a call tree for all processes and threads, just the current process, or for this process's control group. If the call tree is for a multiprocess or multithreaded program, numbers next to the arrows indicate how many times a routine was called when the tree was created.
As you begin to understand your program, you will see that your program may have a rhythm and a dynamic that is reflected in this diagram. As you examine this structure, you will sometimes see things that do not look right--which is a subjective response to the data. These places are often where you want to begin looking for problems.
Looking at the call tree can also tell you where bottlenecks are occurring. For example, if one routine is used by many other routines and that routine controls a shared resource, this thread may be negatively affecting performance. For example, in the previous figure the snore routine might be a bottleneck.


