Displaying Graphs
The File >Options dialog box lets you control how the Visualizer displays the graph.
Graph Options Dialog Box 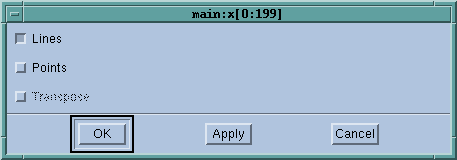
|
The following indicates the meanings of the check boxes within this dialog box.
Lines
If set, the Visualizer displays lines connecting dataset elements.
Points
If set, the Visualizer displays markers for dataset elements.
Transpose
If set, the Visualizer inverts the x and y axis of the displayed graph.