Manipulating Graphs
You can manipulate the way the graph is displayed by using the following actions:
Scale
Press the Control key and hold down the middle mouse button. Move the mouse down to zoom in on the center of the drawing area, or up to zoom out.
Translate
Press the Shift key and hold down the middle mouse button. Moving the mouse drags the graph.
Zoom
Press the Control key and hold down the left mouse button. Drag the mouse button to create a rectangle that encloses an area. This area is then scaled to fit the drawing area.
Reset View
Select View > Reset to reset the display to its initial state.
Query
Hold down the left mouse button near a graph marker. A window pops up displaying the dataset element's indices and value.
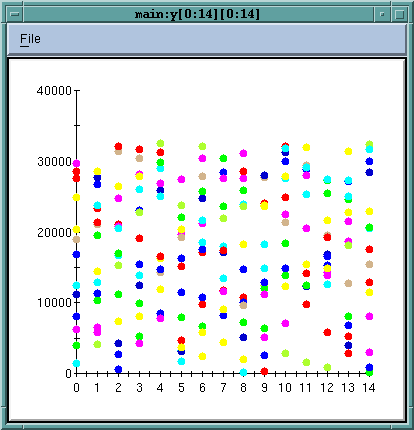
The following figure shows a graph view of two dimensional random data created by selecting Points and deselecting Lines in the Data Window's Graph Options dialog box.
Display of Random Data 
|


