|
|
 |
|
|
|
|
The Process Window
The Process Window displays five panes of information. (The contents of these panes are discussed later in this section.) The large scrolling list in the middle of the Process Window is the Source Pane. As its name suggests, this pane initially contains your source code.
Process Window 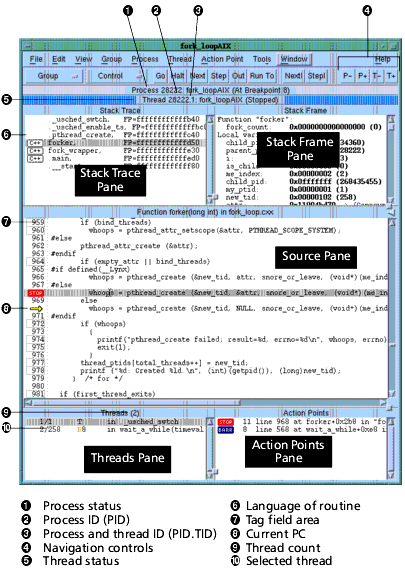
|
In many cases, the way you will start a process is as follows:
- Set a breakpoint in the source code by selecting a boxed line number.
- Type the keyboard accelerator g (for the Process > Go command). The process starts running and then stops at the first breakpoint set.
When debugging a remote process, TotalView displays an abbreviated version of the host name on which the process is running within brackets ([ ]) in the Root Window. The full host name appears in brackets in the title bar of the Process Window. In the following figure, the process is running on the machine hugo.etnus.com, which is abbreviated to [hugo.etn*] in the Root Window.
Root Window Showing Remote 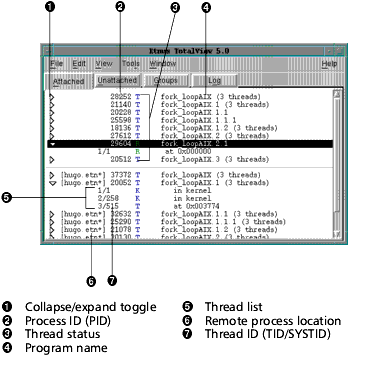
|
As you examine the Process Window figure, notice the following:
- The thread ID shown in the Root Window and in the process's Threads Pane is the TotalView assigned logical thread ID (or TID) and system assigned thread ID (or SYSTID). On systems such as Compaq Tru64 UNIX where the TID and SYSTID values are the same, TotalView displays only the TID value.
In other windows, TotalView uses the value pid.tid to identify a process's threads.
The Threads Pane shows the list of threads that currently exist in the process. The number in the Threads Pane title (9) is the number of threads that currently exist in the process. When you select a different thread in this list, TotalView updates the Stack Trace Pane, Stack Frame Pane, and Source Pane to show the information for that thread. When you dive on a different thread in the thread list, TotalView finds or opens a new window displaying information for that thread.
- The Stack Trace Pane shows the call stack of routines that the selected thread is executing. You can move up and down the call stack by selecting the routine (stack frame). When you select a different stack frame, TotalView updates the Stack Frame and Source Panes to show the information about the selected routine.
- The Stack Frame Pane displays all the function parameters, local variables, and registers for the selected stack frame.
- The information displayed in the Stack Trace and Stack Frame Panes reflects the state of the process when it was last stopped. Consequently, this information is not up-to-date while the thread is running.
- The left margin of the Source Pane--called the tag field area--displays line numbers and icons indicating something about your program. You can place a breakpoint at any source code line that displays object code. (These places are indicated by a boxed line number.) When you place a breakpoint on a line, TotalView overwrites the line number with a STOP icon. The arrow in the tag field shows the current location of the program counter (PC) within the selected stack frame.
Process Window Tag Field Area 
|
- Point of execution. This means that each thread's Process Window has its own unique program counter (PC). When you stop a multiprocess or multithreaded program, the routine selected in the Stack Trace Pane for a thread depends on the thread's PC. When you stop the program, some threads can be executing in one routine, while others might be executing elsewhere.
- The Action Points Pane shows the list of breakpoints, evaluation points, and watchpoints for the process.
|
| |
|
|
|
|