Surface Window
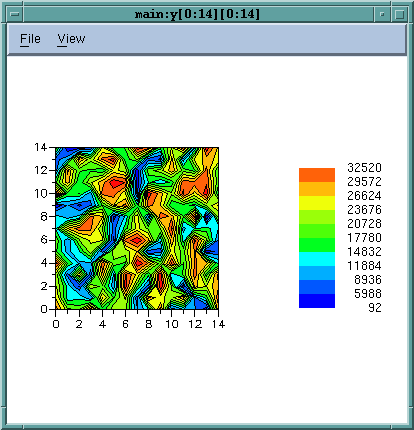
The Surface Window displays two-dimensional datasets as a surface in two or three dimensions. The dataset's array indices map to the first two dimensions (x and y axes) of the display. The following figure shows a two-dimensional map, where the dataset values are shown using only the Zone option. (This demarcates ranges of element values.) For a zone map with contour lines, turn the Zone and Contour settings on and Mesh and Shade off.
Two-Dimensional Surface Visualizer Data Display 
|
You can display random data by selecting only the Zone setting and turning Mesh, Shade, and Contour off. The display shows where the data is located and allows you to click on it to get the values of the various points.
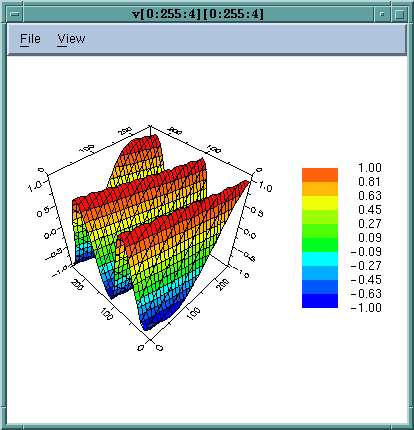
The following figure shows a three-dimensional surface that maps element values to the height (z axis).
Three-Dimensional Surface Visualizer Data Display 
|


