Displaying Surface Data
The Surface Window's File > Options command lets you control how the Visualizer displays the graph.
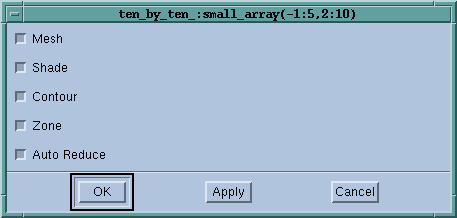
Surface Options Dialog Box 
|
This dialog box has the following choices:
Mesh
If set, the Visualizer displays the surface as a three dimensional mesh, with the x-y grid projected onto the surface. When neither this option nor the Shade option are set, the Visualizer displays the surface in two dimensions
Shade
If set, the Visualizer displays the surface in three dimensions and shaded either in a "flat" color to differentiate the top and bottom sides of the surface, or in colors corresponding to the value if the Zone option is also set. When neither this option nor the Mesh option are set, the Visualizer displays the surface in two dimensions.
Contour
If set, the Visualizer displays contour lines indicating ranges of element values.
Zone
If set, the Visualizer displays the surface in colors showing ranges of element values.
Auto Reduce
If set, the Visualizer derives the displayed surface by averaging over neighboring elements in the original dataset. This speeds up visualization by reducing the resolution of the surface. Clear this option if you want to accurately visualize all dataset elements.
The Auto Reduce option allows you to choose between viewing all your data points--which takes longer to appear in the display--or viewing the averaging of data over a number of nearby points.
You can reset the viewing parameters to those used when the Visualizer first came up by selecting the View > Reset command, which restores all translation, rotation, and scaling to its initial state and enlarges the display slightly.


